New Service
Customer BI
and Reporting Portal
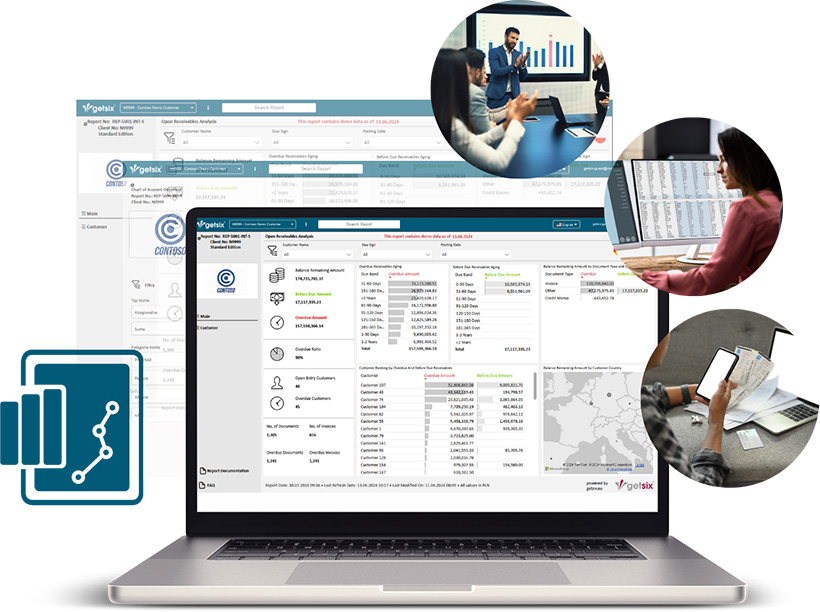
Customer BI and Reporting Portal is an advanced analytical tool that enables companies to analyze detailed reports.
Using Power BI technology, it supports informed decision-making by providing clear and up-to-date insights.
What is the Customer BI and Reporting Portal?
REPORTING AND ANALYTICS
The Customer BI and Reporting Portal is an advanced analytical tool that enables companies to efficiently manage data and generate detailed reports. Thanks to integration with various systems and the use of Power BI technology, this solution supports making informed business decisions by providing clear and up-to-date information.
Due to the complexity of the service, the Customer BI and Reporting Portal solution is divided into two types:
Customer BI and Reporting Portal


INTERACTIVE REPORTS
PORTAL
PDF REPORTS
BY EMAIL
Customer BI and Reporting Portal
IMPLEMENTATION PROCESS
The implementation of Customer BI and Reporting Portal projects is supported by a certified specialist Microsoft Certified: Power BI Data Analyst Associate, ensuring the highest quality of services. We take care of every stage of the project to meet the highest standards. After completion, we send a survey requesting feedback to continuously improve our services.
Schedule a presentation meeting for Customer BI and Reporting Portal. Schedule an online presentation »
During the meeting, together with the consultant, you will select the scope of required reports.
The consultant will prepare a registration form, which you will sign electronically.
Convenient subscription payment and access activation within 1 business day.
01
Schedule a presentation meeting for Customer BI and Reporting Portal. Schedule an online presentation »
02
During the meeting, together with the consultant, you will select the scope of required reports.
03
The consultant will prepare a registration form, which you will sign electronically.
04
Convenient subscription payment and access activation within 1 business day.
OUR BUSINESS INTELLIGENCE SOLUTION EXPERT

Yurii
Business Intelligence Analyst
IT Solutions Department Wrocław
Microsoft Certified:
Power BI Data Analyst Associate
Certification number: 3D44D8-CA64F6
Fabric Analytics Engineer Associate
Certification number: 13737C-C5CV3E

Access plans for Customer BI & Reporting Portal
Our BI platform enables
interactive data analysis and report generation.
Four subscription plans are
available:
Free Plan
- Access to 2 basic reports:
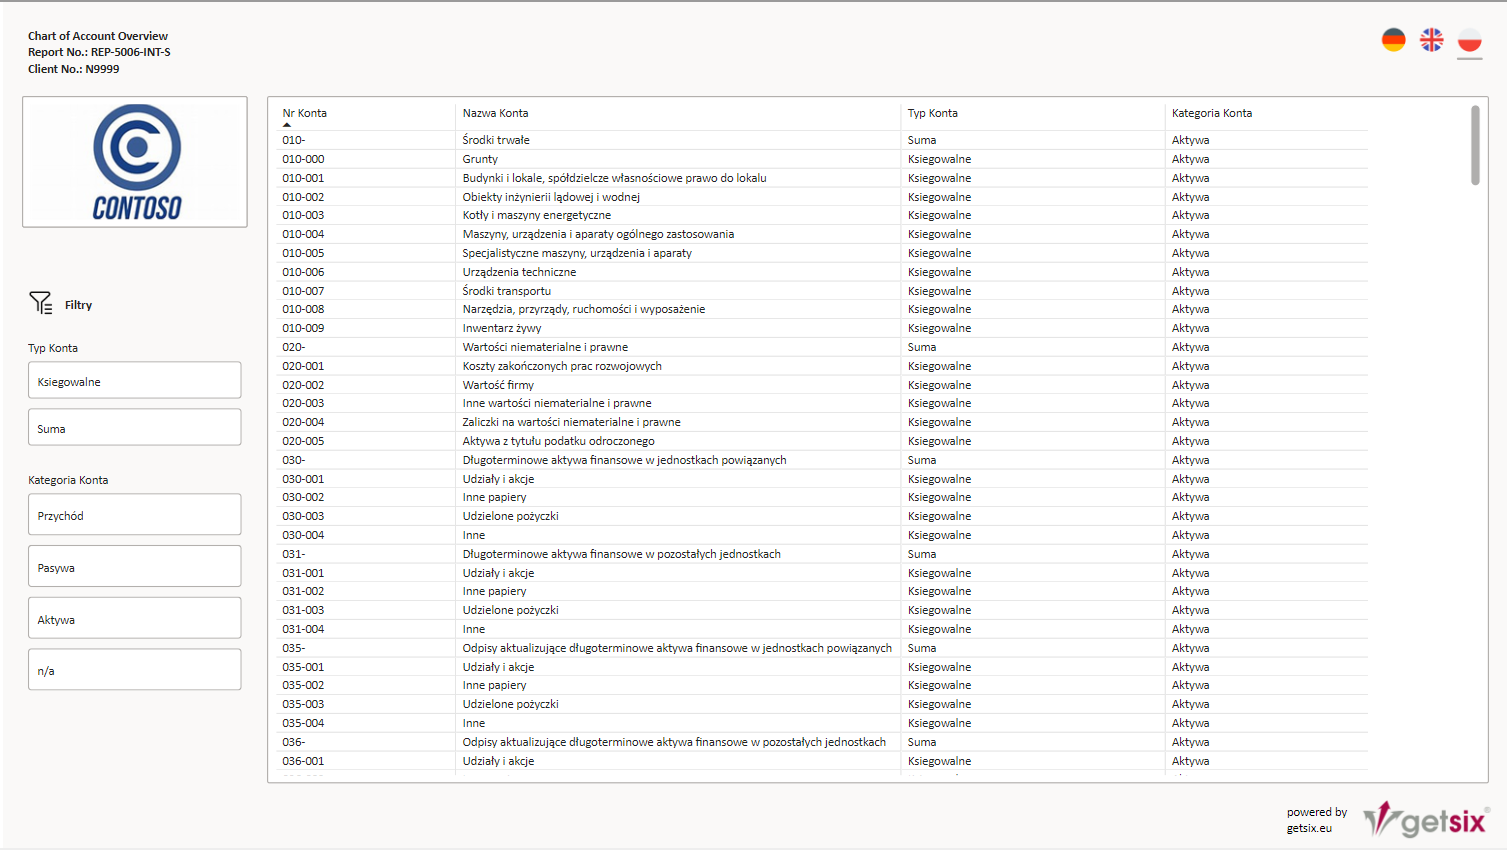
- Chart of Account Overview
- General Ledger Overview
Pro Plan
- Access to the full set of reports (currently 17 reports, with the possibility to add new ones)
- The list of reports is available on the DEMO page in the "Pro" tab
- The Pro plan also includes access to the Free plan
Premium Plan
- Option to select individual reports from the available report pool. (the "Premium" tab on the DEMO page)
- The fee is charged for each user and selected report
- The Premium plan includes access to the Free plan, but does not include access to Pro
Enterprise Plan
- Full customization of the platform and reports according to client requirements
- Dedicated solutions tailored to specific business needs
- Unlimited number of data sources for report preparation
*The configuration fee is charged once at the time of plan selection. If more than one plan is selected (e.g. BI Portal Pro Plan and BI Portal Premium Plan), the fee is charged only once.
The BI Portal Free Plan, BI Portal Pro Plan, and BI Portal Premium Plan are available only for installations of Microsoft Dynamics 365 Business Central with getsix® Services or for active clients using getsix® accounting services.
PDF report subscription plans
We offer three PDF report
subscription plans,
tailored to different business needs:
straight to your
email inbox
Reports Plan
- Includes reports required by the accounting agreement: Profit and Loss Statement and Balance Sheet
- Reports delivered once a month to getsix® Customer Extranet
- Option to send reports to up to 5 email addresses specified by the client.
Reports Plan
- Reports delivered to getsix® Customer Extranet and by email (up to 5 recipients)
- Option to adjust the frequency of report delivery.
- Option to select a report from the pool of interactive reports for PDF conversion.
Reports Plan
- Full customization of reports according to client requirements
- Dedicated solutions tailored to specific business needs
The PDF Free Reports Plan and PDF Scheduled Reports Plan are available only for installations of Microsoft Dynamics 365 Business Central with getsix® Services or for active clients using getsix® accounting services.
About the service
Customer BI and Reporting Portal - Financial Reports
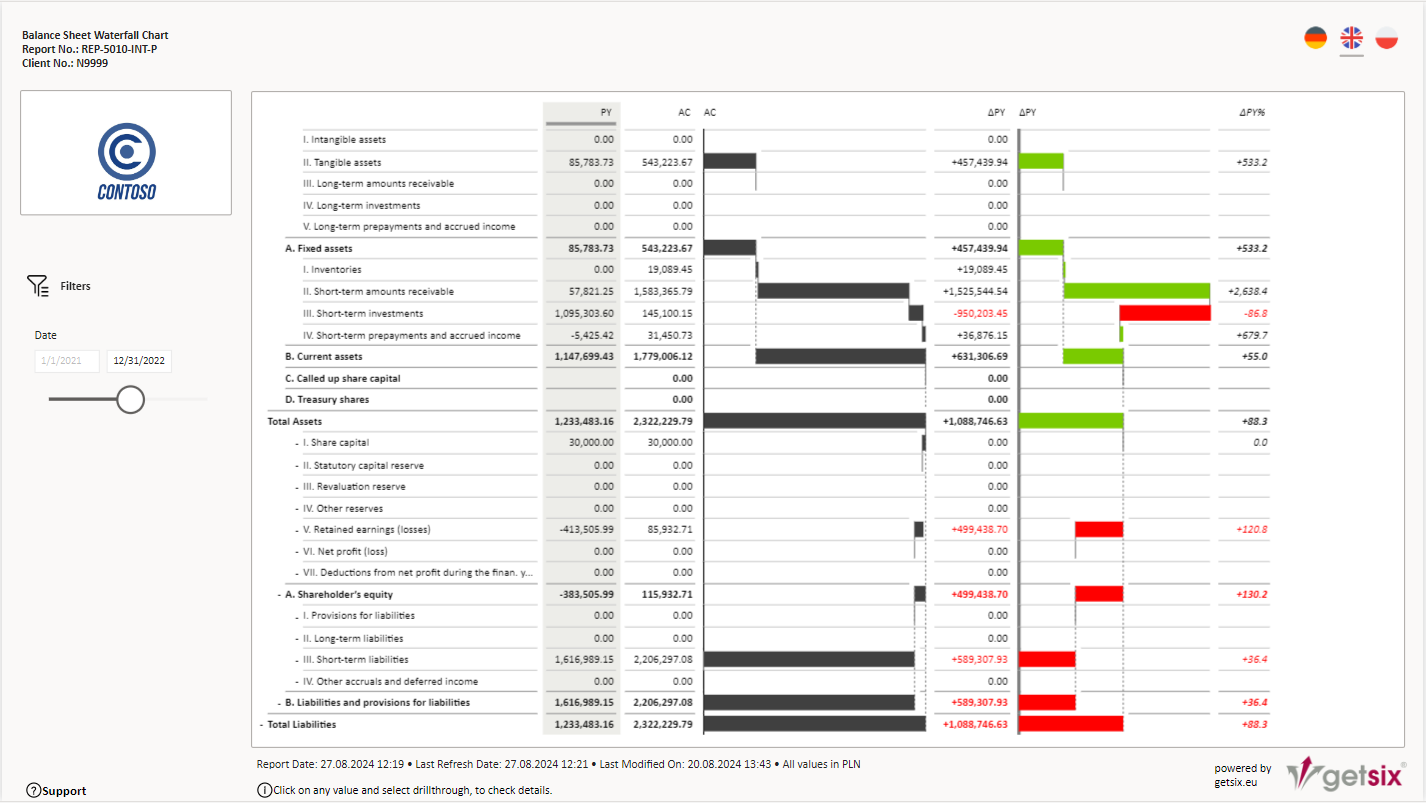
Both reports and financial analytics are used to monitor the financial condition of the enterprise and support strategic decisions by providing precise information on revenues, costs, and profits. They enable the analysis of financial results and forecasting of future trends, which helps in budgeting and resource management.
To meet the needs of our clients, we have prepared standard reports
based on accounting data, which are most frequently requested by them. This solution
reduces the costs of implementation and customization of reports, while ensuring
quick access to key information.
Currently, we offer:
ACCESS TO 2 BASIC REPORTS:
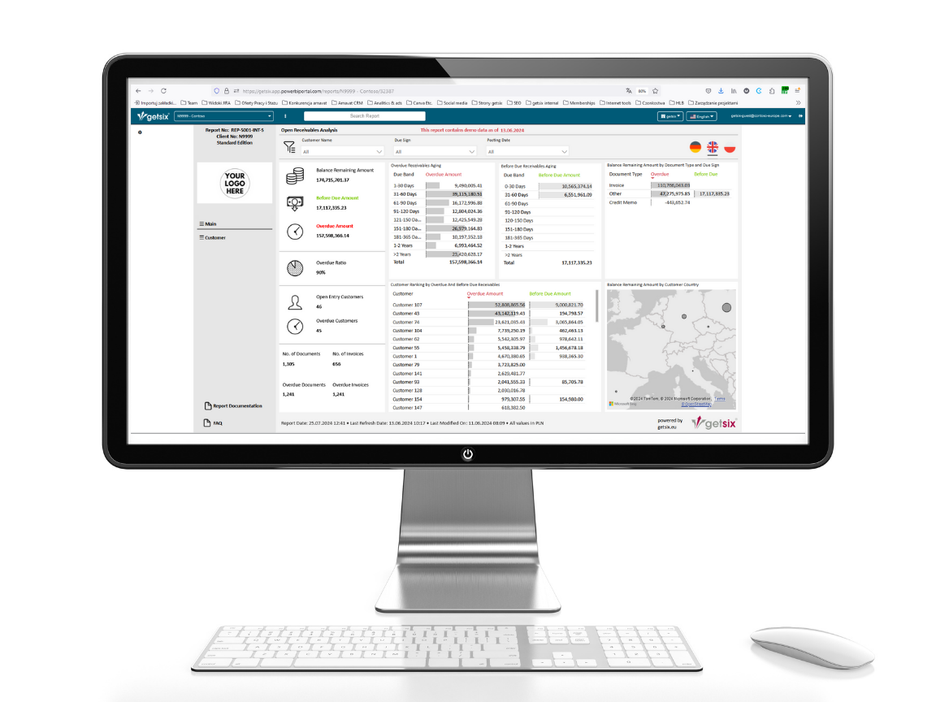
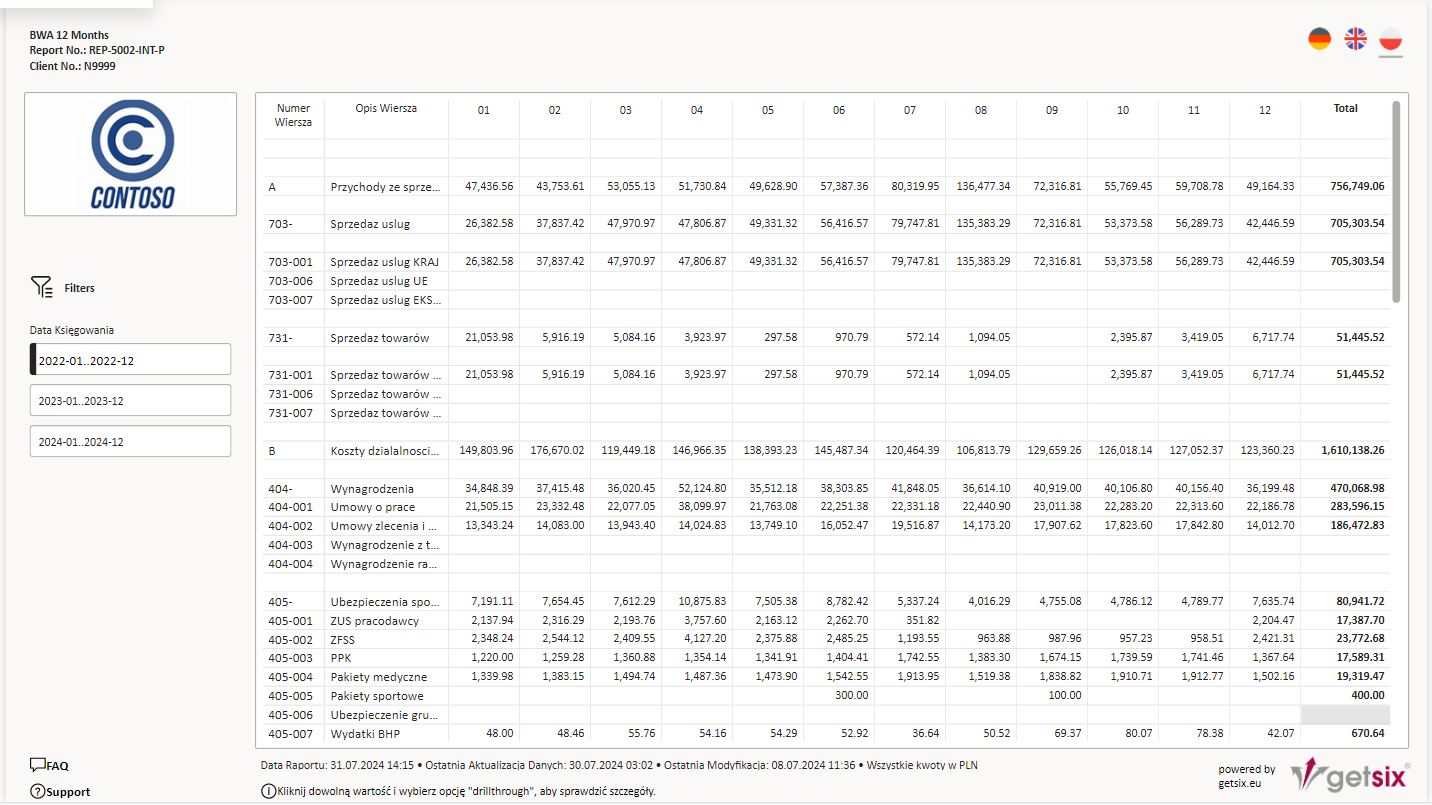
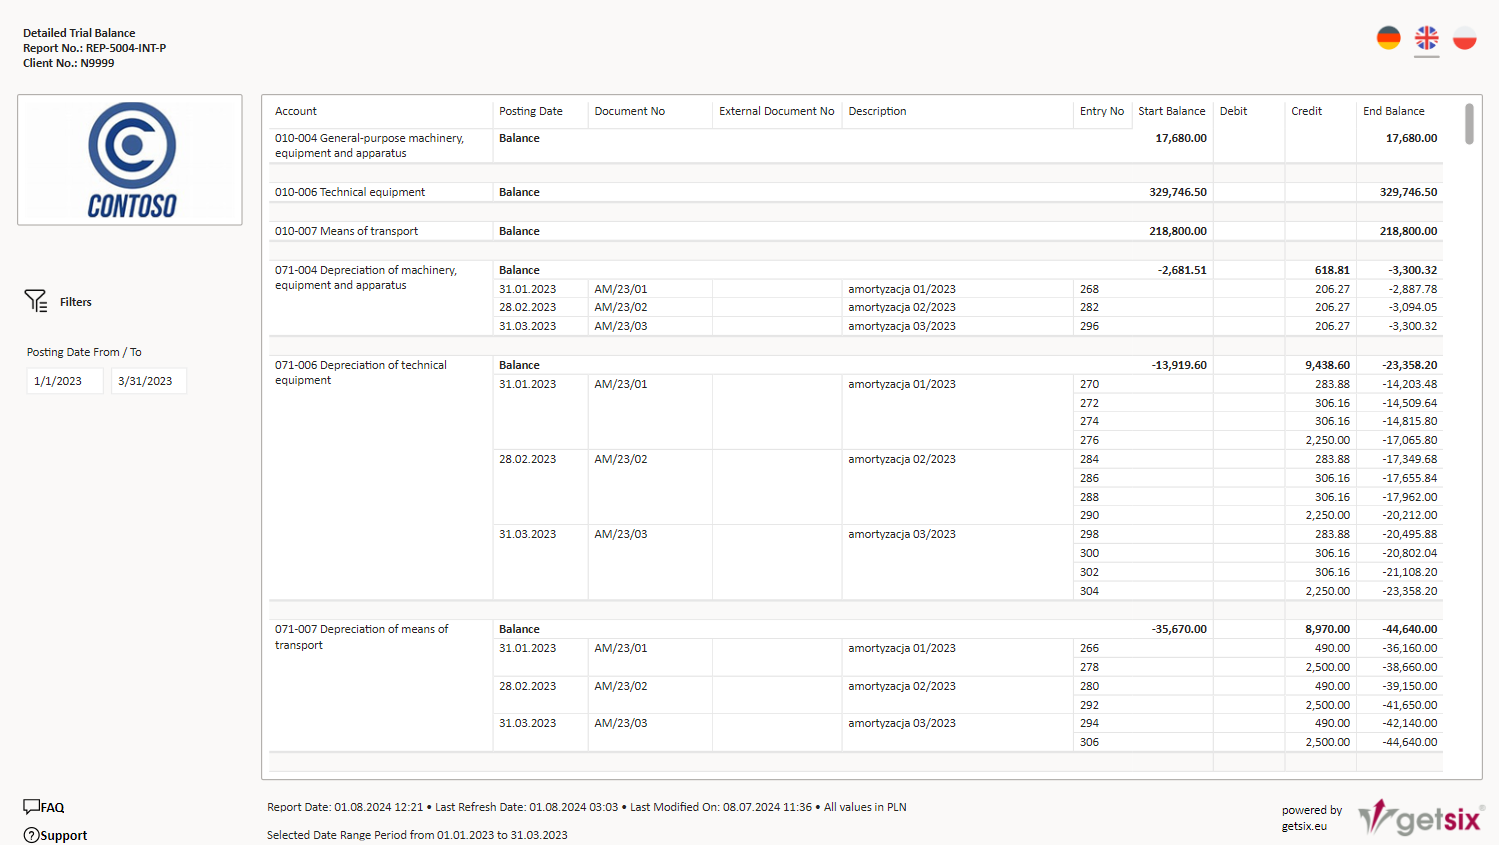
EXAMPLE REPORTS
FROM PRO AND PREMIUM PLAN:
Additional reports based on accounting data are currently in development and will be made available to our clients as part of their subscription.
Reports Gallery
WHAT DO THE BI REPORTS LOOK LIKE?
KEY BENEFITS OF THE CUSTOMER BI AND REPORTING PORTAL SERVICE
WHY IS IT WORTH USING ANALYTICS AND REPORTING (BI) WHEN RUNNING YOUR OWN BUSINESS?
Business Intelligence solutions enable faster and more efficient decision-making through precise data analysis from various sources. They allow for the automation of reporting, they save time and reduce the risk of errors. Additionally, advanced data visualization tools make it easier to understand key business indicators, leading to better results and a competitive advantage.
Minimize the time required to prepare reports from various sources - just log in to the Customer BI and Reporting Portal panel and have all reports in one place.
Reports enable data exploration/drilling, allowing you to find patterns in the data that were previously difficult to notice.
Our BI team supports the process of preparing, analyzing, and systematizing data, so you don't have to handle all the details regarding sources, mapping, or data formats on your own. Our specialists will help you organize the information and can suggest additional improvements.
Elimination of errors in reports caused by manual data processing.
What are the benefits of the Customer BI and Reporting Portal?

FAST IMPLEMENTATION
Access to reports within 1 business day after payment in the subscription model.

LIMITED COSTS
Clients using our solution do not need to invest in Power BI licenses or engage specialists for its implementation – everything is provided as part of our service.

START WITH READY-MADE REPORTS AND VISUALIZATIONS
You don't waste time building reports from scratch – you get a ready set of useful, proven, intuitive, and clear reports that are available immediately after system launch. This allows you to immediately start analyzing data and making better business decisions.

SIMPLICITY WITHOUT COMPROMISE
You don't have to be a BI specialist – our solution is intuitive and user-friendly. Even people without technical background will quickly find their way in the reporting environment and will be able to work effectively with data.

SCALABILITY AND DEVELOPMENT
The solution is ready for development – you can add or remove new reports, modules, or data sources over time, without having to build everything from scratch.

FULL CONTROL AND DATA SECURITY
Our solution ensures compliance with data governance principles – data is organized, secure, and accessible only to authorized users. This gives you not only transparency and consistency of information, but also the certainty that your financial data is managed according to best practices and industry standards.
What else can we do?
Power BI - Management Reports
Management reports using Business Intelligence (BI) tools are designed to monitor key performance indicators and support decision-making at the management level. They enable managers to quickly and efficiently analyze data, identify trends, and evaluate business performance.
EXAMPLES OF MANAGEMENT REPORTS FROM OUR PORTFOLIO:
MOST COMMONLY USED DATA SOURCES:
- ACCOUNTING AND INVOICING SYSTEMS
- WAREHOUSE DATA
- PAYMENT GATEWAYS
- MARKETPLACES, ONLINE STORES
- MARKETING DATA
- CRM, ERP, HR SYSTEMS, etc.
Data for Business Intelligence solutions can be provided in formats such as Excel files (XLS, XLSX), CSV files (Comma-Separated Values), SQL databases, XML files, JSON files, web services (API), and ERP and CRM systems. These formats allow for flexible and efficient integration of data into BI solutions, enabling further analysis and visualization.

Download PDF
Management control and comparison of performance of several companies operating in different countries.

Management control and comparison of performance of several companies operating in different countries.
Client: Since 2015, we have been providing accounting services in Poland for a company in the forestry industry. From the beginning of our cooperation, the management team placed great emphasis on a reporting system for management control and comparison of the results of companies from different European countries.
Sector: Forestry industry
Competencies: Power BI, Microsoft Dynamics 365 Business Central, getsix® Customer Extranet
Business need: Management accounting for controlling and comparing the performance of the Polish company with other companies in the group.
Developed solutions: As part of the project, we implemented an online reporting system that retrieves current data from the accounting system and uses the Power BI service to generate reports according to the client's guidelines and in a format convenient for them. The new reporting system replaced the old spreadsheet, which was sent once a month and required additional steps to conduct a full analysis of costs, revenues, assets, and liabilities.
Analysis of the complaint process in terms of quantity and cost for an e-commerce client
Client: Since 2020, we have been working with a large e-commerce company in Poland, which offers a wide range of consumer products online. The company needed support in analyzing the complaint process to better understand its impact on operations and operating costs.
Sector: E-commerce
Competencies: Power BI, Microsoft Dynamics 365 Customer Service, getsix® Customer Extranet, Logic Apps
Business need: The client wanted to effectively manage the complaint process, understand the quantitative and cost aspects of complaints, and identify areas that require improvement. The goal was to reduce the number of complaints and optimize the costs associated with handling complaints.
Developed solutions: As part of the project, we created an advanced analytical tool in Power BI that integrates data from various customer service and sales systems, enabling a comprehensive analysis of the complaint process. This tool allows for ongoing monitoring of the number of complaints and their costs, as well as identifying causes and trends.
Preparation of a management dashboard of logistics indicators for the warehouse process in Power BI
Client: Since 2019, we have been working with a logistics company in Poland, providing data analysis and reporting services. From the beginning of our cooperation, the company expressed the need for advanced tools to monitor and optimize warehouse processes.
Sector: Logistics and warehouse management
Competencies: Power BI, Microsoft Dynamics 365 Supply Chain Management, getsix® Customer Extranet
Business need: The company's management needed an effective tool to monitor key logistics indicators of the warehouse process, such as order fulfillment time, inventory levels, delivery timeliness, loading and unloading times, and employee performance indicators. This dashboard was used in morning manager meetings to analyze the main indicators of the logistics process, which allowed for improving warehouse operations and making informed decisions based on current data.
Developed solutions: As part of the project, we created an advanced management dashboard in Power BI that integrates data from various warehouse and logistics systems, providing a complete picture of warehouse processes. The dashboard allows for ongoing monitoring of key performance indicators (KPIs) and identification of areas that require optimization.
Analysis of electricity costs for a chain of stores
Client: Since 2018, we have been working with a retail chain in Poland, providing accounting and analytical services. From the very beginning, the company's management placed great emphasis on effective management of operating costs, particularly on the control and optimization of electricity costs in individual stores.
Sector: Retail
Competencies: Power BI, SQL Server, Logic Apps
Business need: Effective management of electricity costs in the chain of stores, enabling the comparison of energy consumption and costs between different locations and identifying areas requiring optimization. The business need also includes cost analysis for reduction purposes and "what-if" analysis to assess changes in costs based on consumption.
Developed solutions: As part of the project, we implemented an advanced reporting system that collects current data on electricity consumption from all stores in the chain. By using Power BI, the data is analyzed and processed in real-time, generating reports according to the client's guidelines. The new system replaced the previous manual data collection methods, which were time-consuming and prone to errors.
Customer BI and Reporting Portal
Functionalities of our solution
01
Automation and data updates based on a defined Service Level Agreement (SLA)
02
Interactive and more intuitive visualizations.
03
Data integration from various sources (e.g., databases, CRM, ERP systems)
04
Scalability and adaptation to large data volumes.
05
Security and control of sensitive data.
06
Real-time collaboration among multiple users.

Customer BI and Reporting Portal
Manage your organization through financial data analysis
Service Standard
Proven solutions
for your business from getsix®
We decided to develop the Customer BI and Reporting Portal service, because we noticed a growing need for it among our clients. As an accounting firm, we understand that the data we handle can significantly contribute to more efficient management of the enterprise. We want our clients to have access to comprehensive solutions in one place, without the need to seek external providers. Our service standard guarantees:
Dedicated
client manager
We guarantee direct contact with an assigned manager who will provide individual support tailored to your needs. Our team is always ready to deliver professional support at the highest level, ensuring the satisfaction and comfort of our clients.
Systematic service implementation process
We work according to recognized methods, with a continuously improved process that will guide you through the entire project. Our experts are Microsoft certified. We are official partners of technology providers and hold certifications that confirm our competencies.
Communication, reporting
and agreements in 3 languages
In line with our clients’ preferences, we offer communication in three languages: Polish, English, and German. Reports, forms, and other necessary documents are also provided in these languages, ensuring full clarity and transparency in an international business environment.
Practice, experience, and data security
We have been present on the Polish market for nearly 20 years. We focus on innovation and the development of our business, backed by many years of experience.


