
Financial controlling and the 4 types of BI dashboard users – how to create tools that truly meet business needs
BI dashboards (Business Intelligence) have become an indispensable element of finance and management work. In particular, financial controlling has gained new capabilities thanks to them – from real-time budget tracking and cost analysis to monitoring variances and reacting quickly to warning signals from the business.
These tools – when well designed – can drastically shorten the time between identifying a problem and making a decision. In practice, however, many companies fail to unlock their full potential. The main reason? Dashboards are often designed as one-size-fits-all solutions, without considering who will be using them and for what purpose.
However, financial controlling is not just about data analysis – it’s primarily about delivering the right information to the right audience. Whether it’s a CFO needing a quick snapshot of KPIs or an analyst diving into cost structures, each user has a different role, pace of work, and set of expectations. And that should shape how BI dashboards are designed.
That’s why it’s worth understanding the four key types of BI dashboard users, and learning how to build solutions that genuinely support financial controlling – instead of complicating it.
Depending on user needs, data can be presented in various ways. getsix® offers both an interactive Customer BI and Reporting Portal for working with data online, and scheduled PDF reports automatically delivered according to a set schedule. These two forms can be used in parallel – so that each user receives information in the format that suits them best.
In this article:
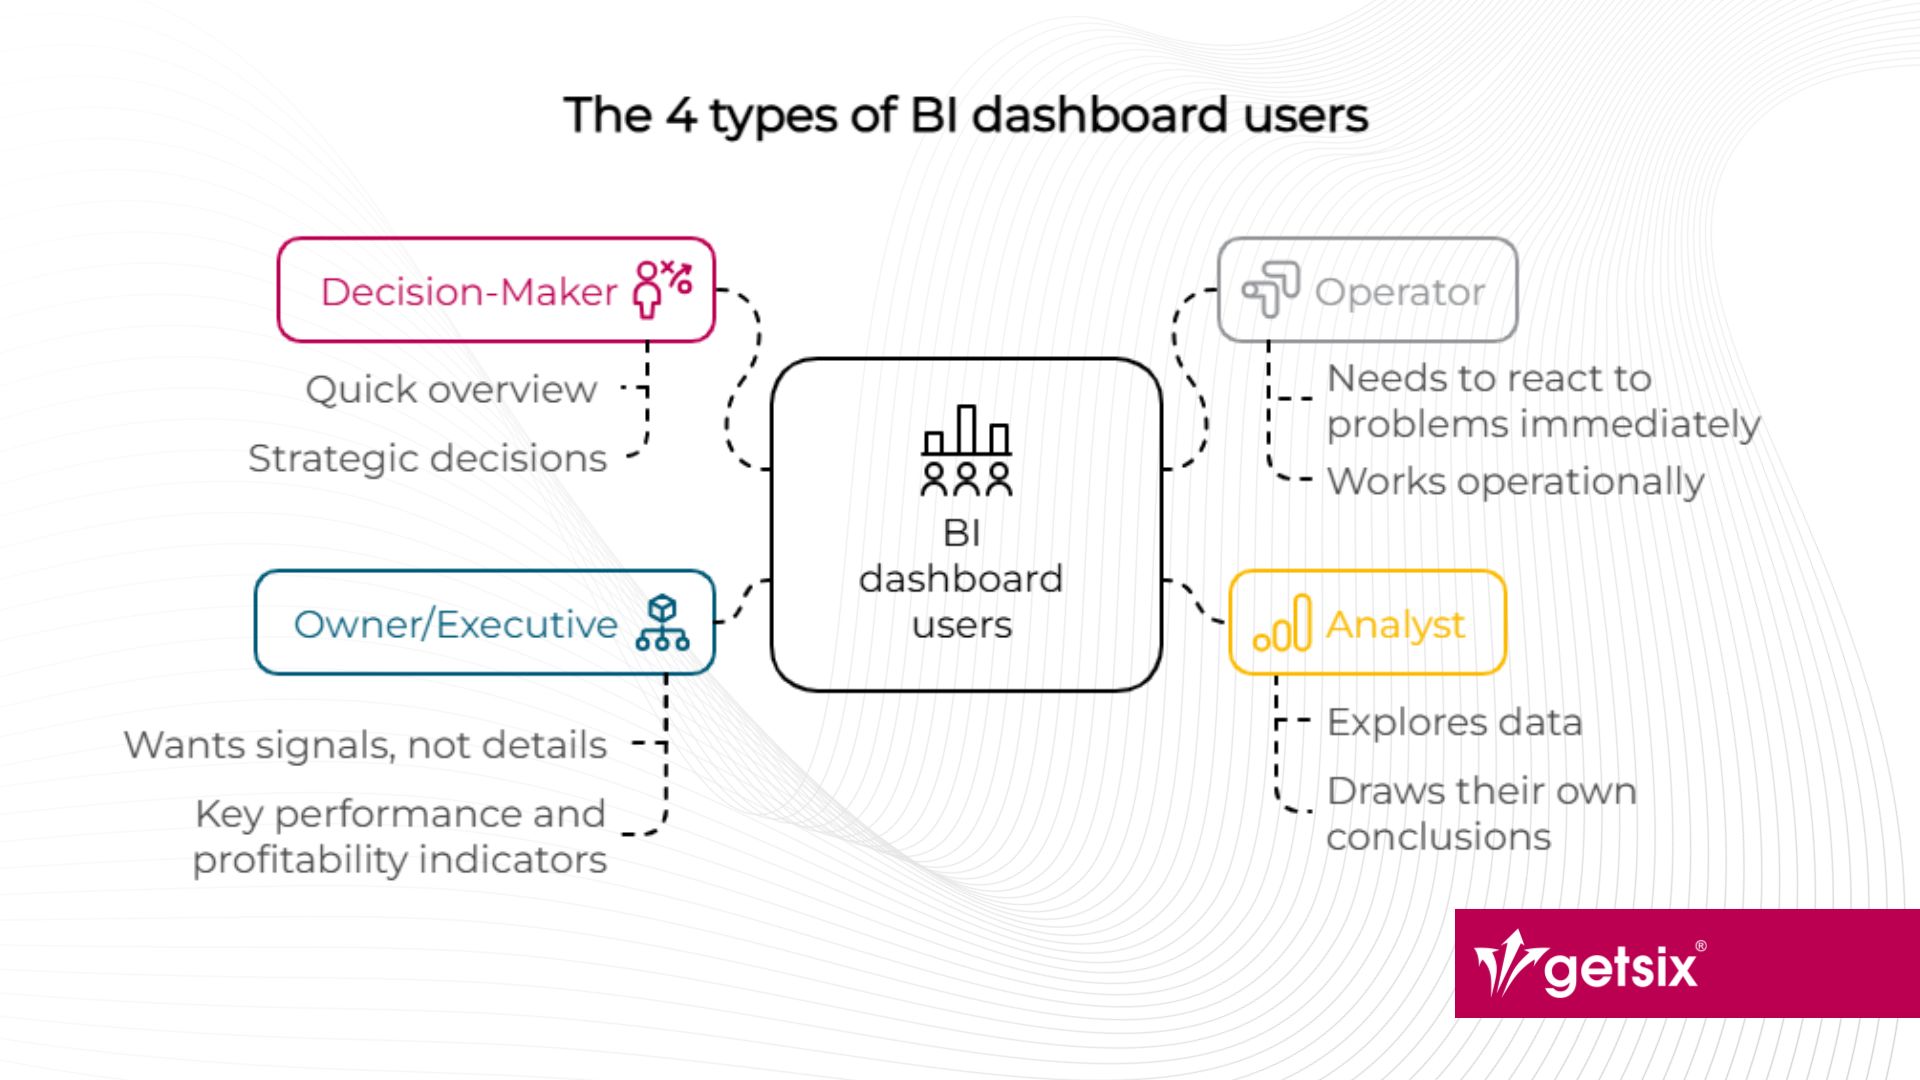
The 4 types of BI dashboard users
In real-life projects, we most often encounter four core user profiles – each one engages with data differently and expects different functionality:
- The Decision-Maker, who needs a quick overview to make strategic decisions,
- The Operator, who works operationally and needs to react to problems immediately,
- The Analyst, who explores data deeply and draws their own conclusions,
- The Owner or Executive, who looks at the big picture and wants signals, not details.
To sum up, each of these roles brings something different to the organization – and each requires a completely different approach to dashboard design. Let’s take a closer look at each user type and explore how to design BI tools tailored to their real needs.
Type 1: The Decision-Maker
Who are they? CFOs, department heads, board members
Main goal: Making quick, strategic decisions
Decision-makers don’t have time to filter data. They need a quick glance to understand whether the company – or a department – is on track or not.
How to design dashboards for decision-makers:
- 3–5 key metrics (e.g. EBITDA, cash flow, gross margin)
- Clear color coding: green = OK, red = needs attention
- Year-over-year and budget comparisons
- No interactivity – information must be passive and easy to read
Example: A CFO at a manufacturing company checks the dashboard every morning and within 20 seconds knows whether the company’s operating result is within budget.
Type 2: The Operator
Who are they? Procurement specialists, logistics coordinators, service managers
Main goal: Reacting to day-to-day problems
Operators don’t care about trends – they’re focused on what’s broken today. Delayed shipment? Overproduction cost? Equipment failure?
How to design dashboards for operators:
- Highlight alerts and anomalies
- Prioritize minimalism: function over form
- Enable action from within the dashboard (e.g. create a ticket)
Example: A logistics manager sees that three shipments are overdue. They can act immediately – before the customer even notices.
Type 3: The Analyst
Who are they? Controllers, BI specialists, data analysts
Main goal: Deep analysis, forecasting, root cause investigation
These users “live in the data”. They dig through charts, pivot tables, and metrics. For them, the dashboard is not just a report – it’s a workspace.
How to design dashboards for analysts:
- Filtering by time, segment, channel
- Detailed tooltips, breakdowns, and trend visuals
- Maximum flexibility – minimal layout restrictions
Example:A financial controller builds a quarterly margin forecast using sales and variable cost data – all directly from the dashboard.
Type 4: The Owner or Executive
Who are they? CEOs, investors, company owners
Main goal: Vision, ROI, direction of the business
This is a user who wants to see the big picture. They are not interested in operational details – only key performance and profitability indicators.
How to design dashboards for executives:
- One screen = one clear answer
- No clutter – only essential indicators
- Instant clarity: are we above or below target?
Example: The CEO opens the dashboard once a week and immediately sees the ROI on the new business unit.
A dashboard tailored to your business – without designing it yourself
You don’t need to know how to design the perfect report – just tell us what you need. At getsix®, we create reporting solutions and dashboards tailored to your specific processes, data, and decision-making needs. It can be a completely new project or a small modification of an existing report – the result will always meet your real expectations.
Want to find out how this could work for you? Schedule a free consultation with our expert.
Summary – financial controlling as the architect of dashboards
Financial controlling is not just about calculating costs – it’s about delivering insight to the right people in the right format.
Before you start designing a dashboard, ask yourself:
- Who will be using this dashboard?
- What decisions should this person be able to make?
- Does the design drive action, or just display data?
In conclusion, a well-designed dashboard is a decision tool – one that shortens the path from problem detection to resolution. Therefore, it is exactly what effective financial controlling is all about.
The company getsix® Services has been an integral part of the getsix® Group for nearly 20 years, enabling them to provide tested and refined solutions for clients in the service industry who require efficient accounting and financial controlling solutions.
If you have any questions regarding this topic or if you are in need for any additional information – please do not hesitate to contact us:
CUSTOMER RELATIONSHIPS DEPARTMENT

ELŻBIETA
NARON-GROCHALSKA
Head of Customer Relationships
Department / Senior Manager
getsix® Group


***